You know Store 14 is underperforming. You don't know if it's a POS problem, a staffing problem, or a process problem.
Revenue variance by store is easy to see in your ERP. The reason behind it isn't. Pulse correlates performance variance with operational signals — EOD overruns, ghosted POS frequency, BOPIS cancellation rate, compliance scores — so your area managers have an actionable diagnosis, not just a red number on a chart.
The cost of not catching this.
Misdiagnosed variance = wrong intervention
A store underperforming by 8% that's blamed on 'weak local management' when the actual cause is 3× higher POS downtime doesn't get fixed. It gets managed — with a performance conversation that changes nothing.
Area manager span-of-control problem
An area manager covering 8–12 stores can't diagnose operational causes of variance during a monthly store visit. They need the signal before the visit, not after the conversation.
Compounding effect
A store that underperforms for 3 months because of an undiagnosed IT issue loses 90 days of trading performance. The cost is visible in hindsight; Pulse makes it visible in real time.
How Pulse catches it.
Operational health scoring
Pulse calculates a per-store operational health score that combines POS uptime, EOD overrun frequency, compliance posture, and BOPIS fulfilment rate. Stores with low health scores show up in the fleet view before they show up as underperformers in the ERP.
Ask Pulse correlation analysis
"Which stores have the highest POS downtime and the lowest revenue vs. comp?" — Pulse correlates the operational signals it monitors against performance data to surface the most likely causal candidates.
Pulse Daily integration
The CXO's morning email flags stores that have dropped below the health score threshold alongside their revenue performance. The area manager gets the same signal before their weekly store call — not after reviewing the ERP.
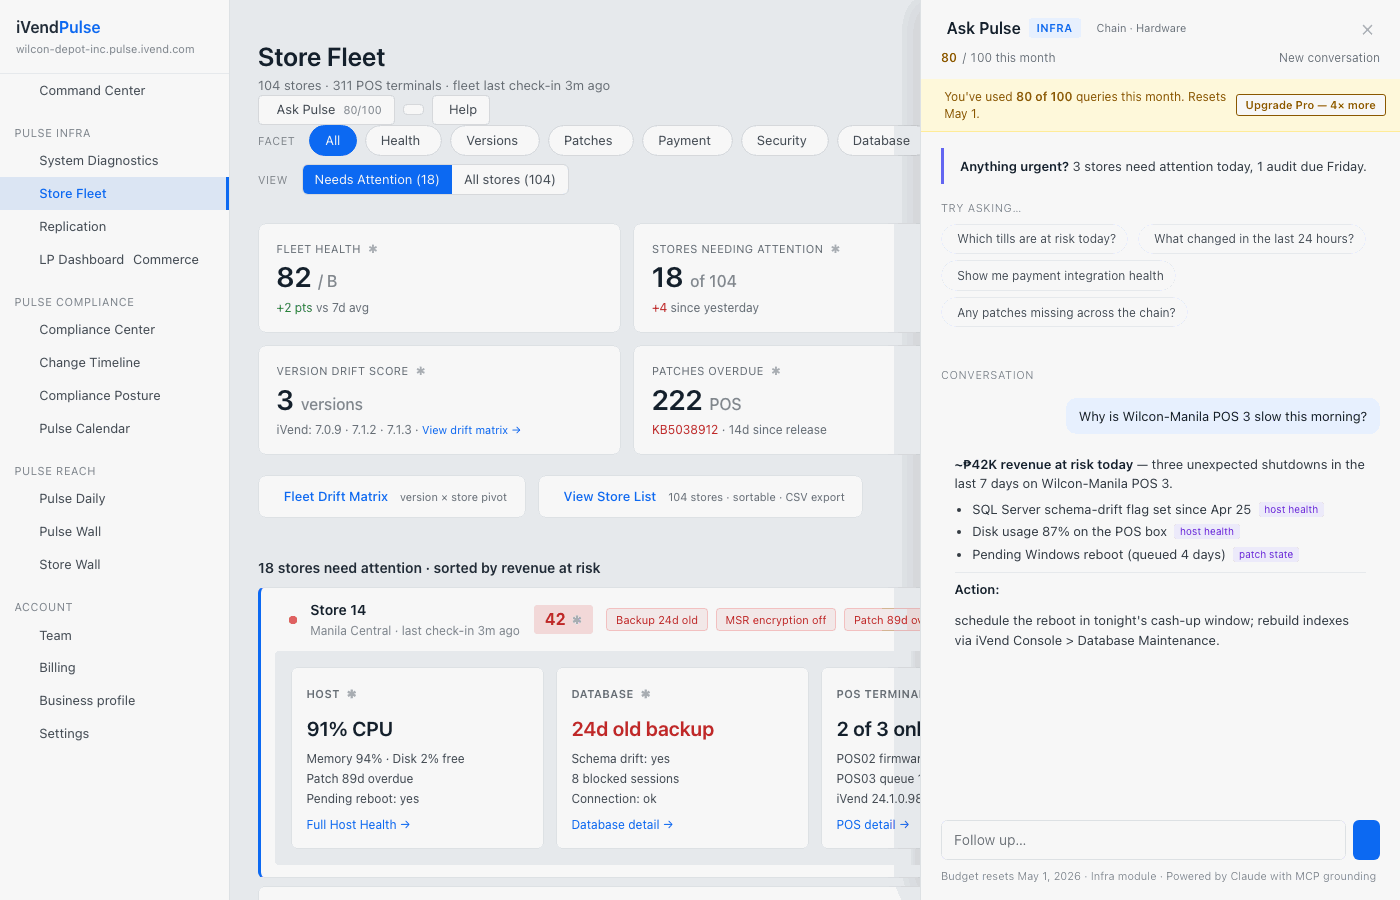
What you'd see.

Is this your problem to solve?
Store variance is a CXO concern — area managers are the intervention point.
What it costs.
Store performance variance analysis is included in Pulse Infra — per-POS-terminal, billed monthly. Pro tier adds Pulse Daily email briefings with health-score-to-revenue correlation for the CXO and area manager inboxes.
Estimate your monthly cost
Worked example — Chain M (FreshMart)
- 3 Infra Pro seats × $69 = $207
- 48 POS @ Pro band (50 × $7) = $336
- 12 Store Manager seats × $19 = $228
- 1 Compliance Standard seat (bundled with Infra) = $0
- = $771/mo USD